We don't have a strong view of the near-term timing of when the Bank of England (BoE) will cut rates, where at the time of writing, the market is pricing in three BoE rate cuts by the end of Q3 of 2024, which looks broadly correct. But ultimately what matters more for the gilt market is where the BoE base rate will be in 2025-2030, rather than in Q2 or Q3 2024. We still believe that the UK economy, like much of the rest of the world, has still not yet felt the majority of the aggressive rate hikes of 2022-2023, given that it takes around 12-18 months for any change in interest rates to have an effect on the economy. If growth does continue to weaken, then this might even push UK inflation below target.
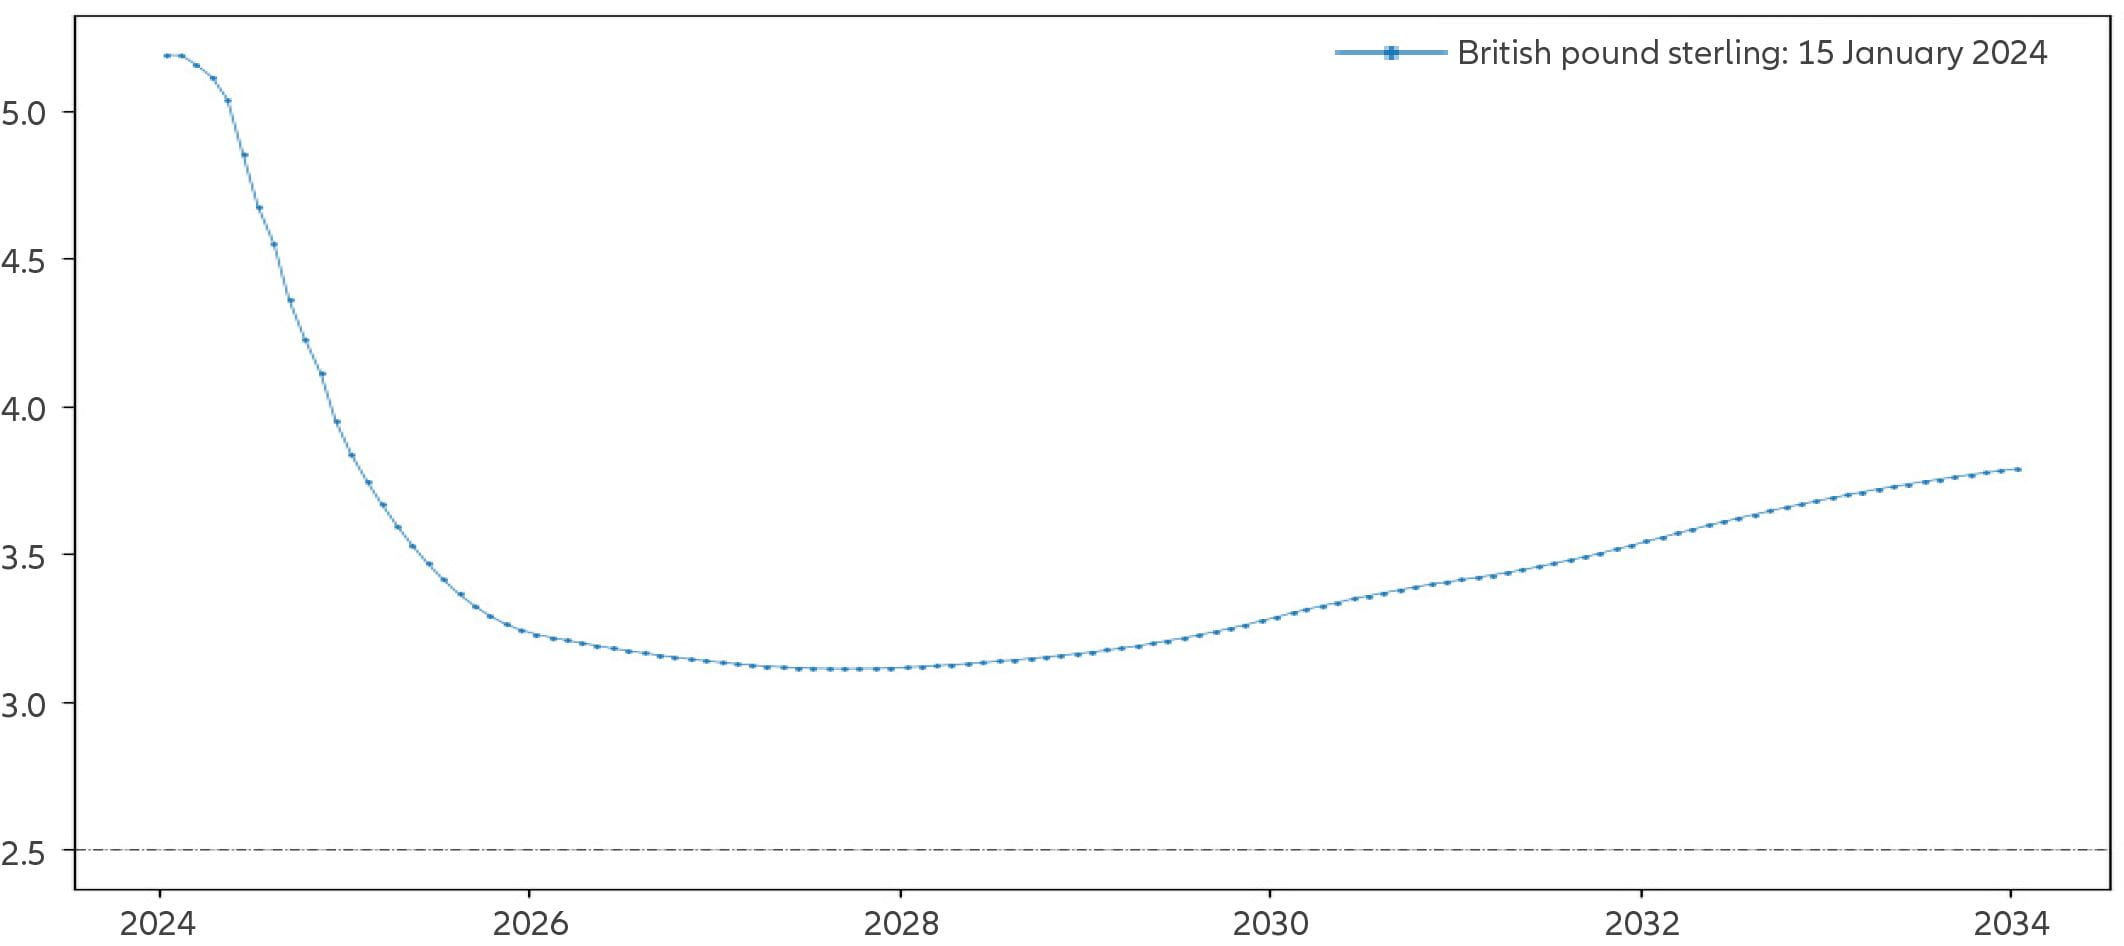
The first chart below shows the market-implied forward path of overnight rates, derived from the GBP interest rate swap curve, month by month, over the next 10 years. The course of the blue line shows that the current shape of the GBP yield curve implies overnight interest rates (which are closely following the BoE base rate) to remain above 3% until 2026 and to not fall below 3% ever again over the next 10 years. Note that this is derived from the swap curve, where implied interest rates from the gilt market are even higher beyond 2025.
Chart 1: Market-implied forward overnight rates, monthly for the next 10 years

Source: Bloomberg, data as at 15/01/2024. Past performance does not predict future returns.
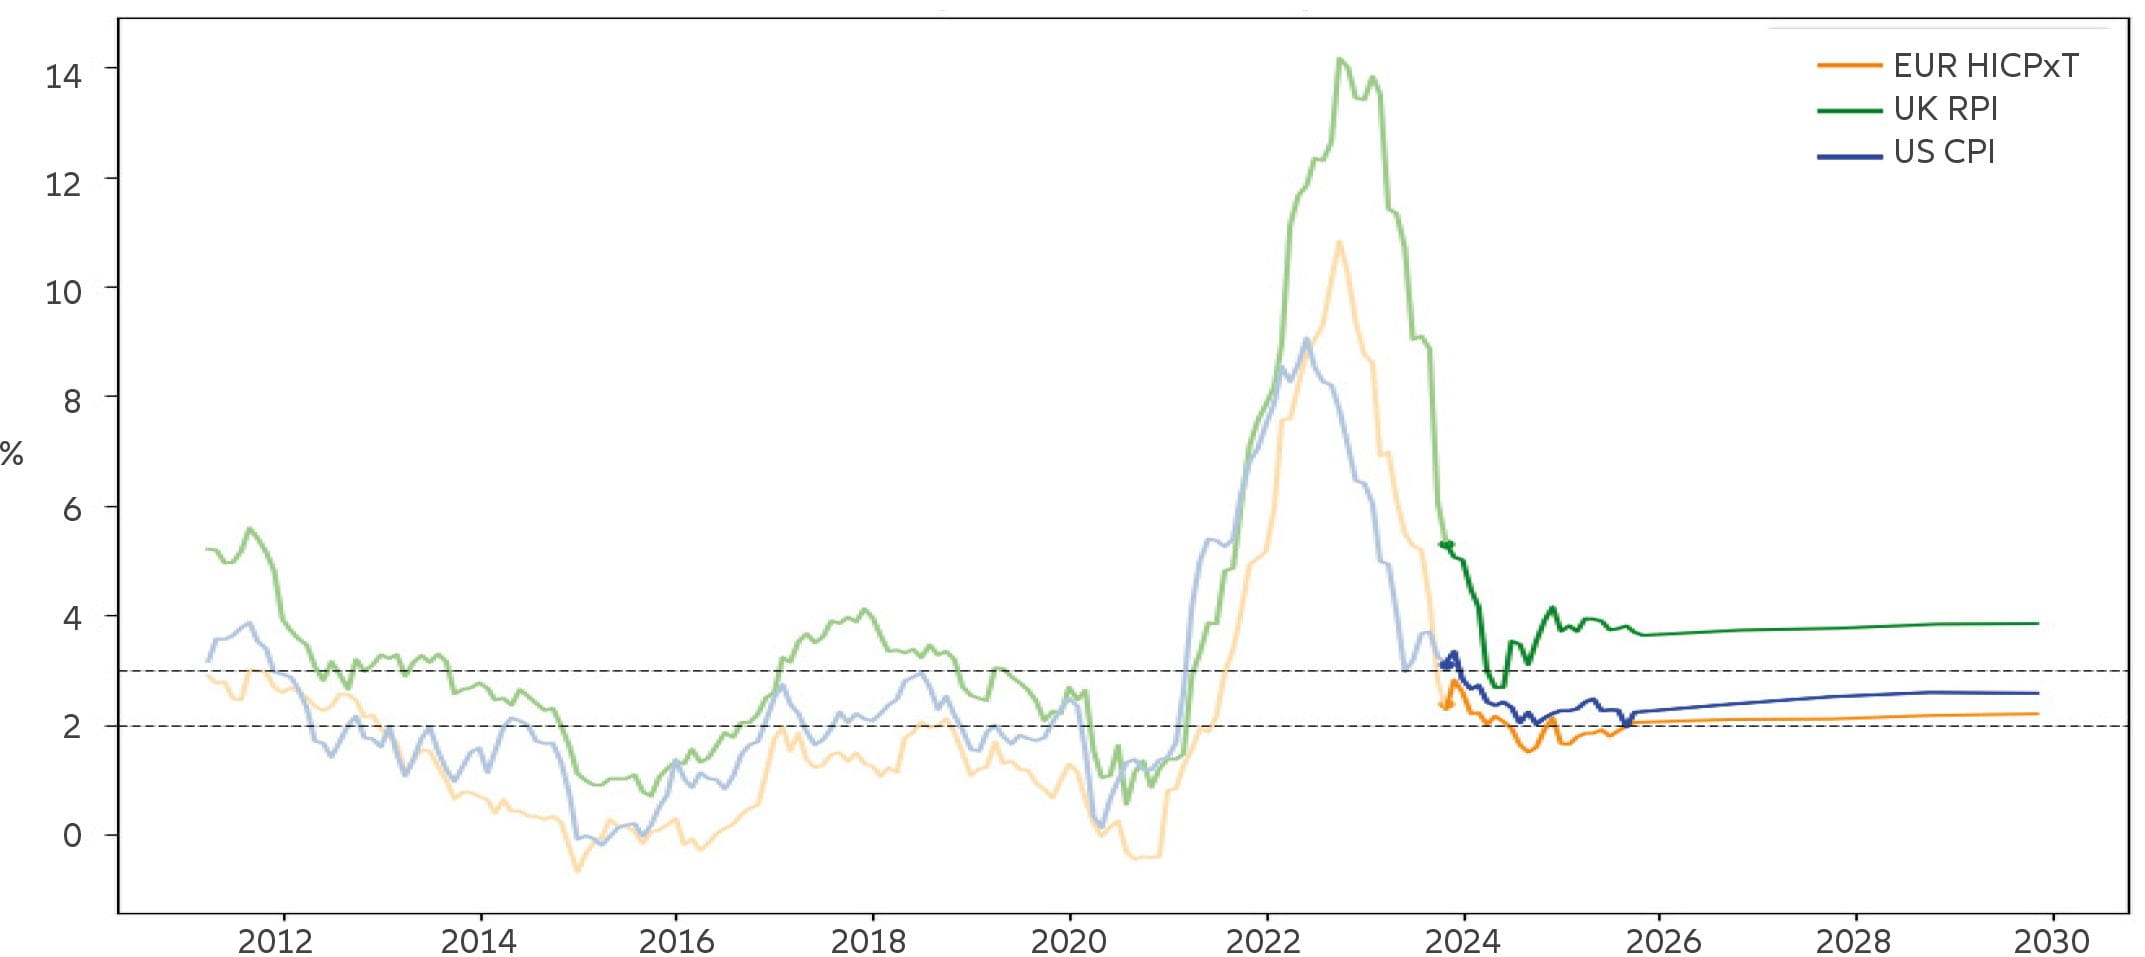
It would make sense for markets to price in historically high nominal interest rates for a long period of time if markets were very concerned about long-term inflation dynamics. However, this is not the case, where inflation markets are instead pricing in a sharp drop of Retail Price Index (RPI) inflation to a level of 3.5%1 by mid-2024. Taking into account the historical wedge between the Consumer Price Index (CPI) and RPI, the market is expecting CPI inflation to fall back to 2.5% quickly. While this is above the BoE’s 2% target, it’s worth bearing in mind that market implied inflation will include a risk premium – inflation protection is like an insurance contract, and people pay up for protection. Insuring against UK inflation is likely to be very elevated at the moment, implying that that market’s ‘pure’ view of where medium-term inflation is headed is likely closer to 2%.
Chart 2: Market-implied inflation rates, monthly until 2030

Source: Bloomberg, data as at 02/01/2024. Past performance does not predict future returns. EUR HICPxT = The Harmonised Index of Consumer Prices of the euro area, excluding tobacco
The two charts above combine to imply an economic scenario where inflation is quickly falling back towards target, whilst not only will a recession be avoided, but growth will be above trend over the next few years. In other words, there is a divergence between the scenario priced in by inflation markets and what rates markets are expecting – markets are indicating that nominal interest rates will be maintained at ~1% above inflation.
We think inflation market pricing is currently fair. Global producer prices across major economies (including the UK) are now deflationary and producer prices tend to lead headline inflation, which leads core inflation (please see our blog for further detail).
It is the rates market that is mispriced in our view. We do not think that the economy is immune to the super aggressive global monetary tightening kicked off by the BoE at the end of 2021. There are some arguments that can be made for why the lags between interest rate increases and their impact on global growth this time around may be a little longer than the ~12 months historically seen in economic cycles (eg excess savings, still elevated corporate earnings, households and corporations terming out debt in 2020, labour hoarding etc). But this just delays the crunch, it doesn’t prevent it.
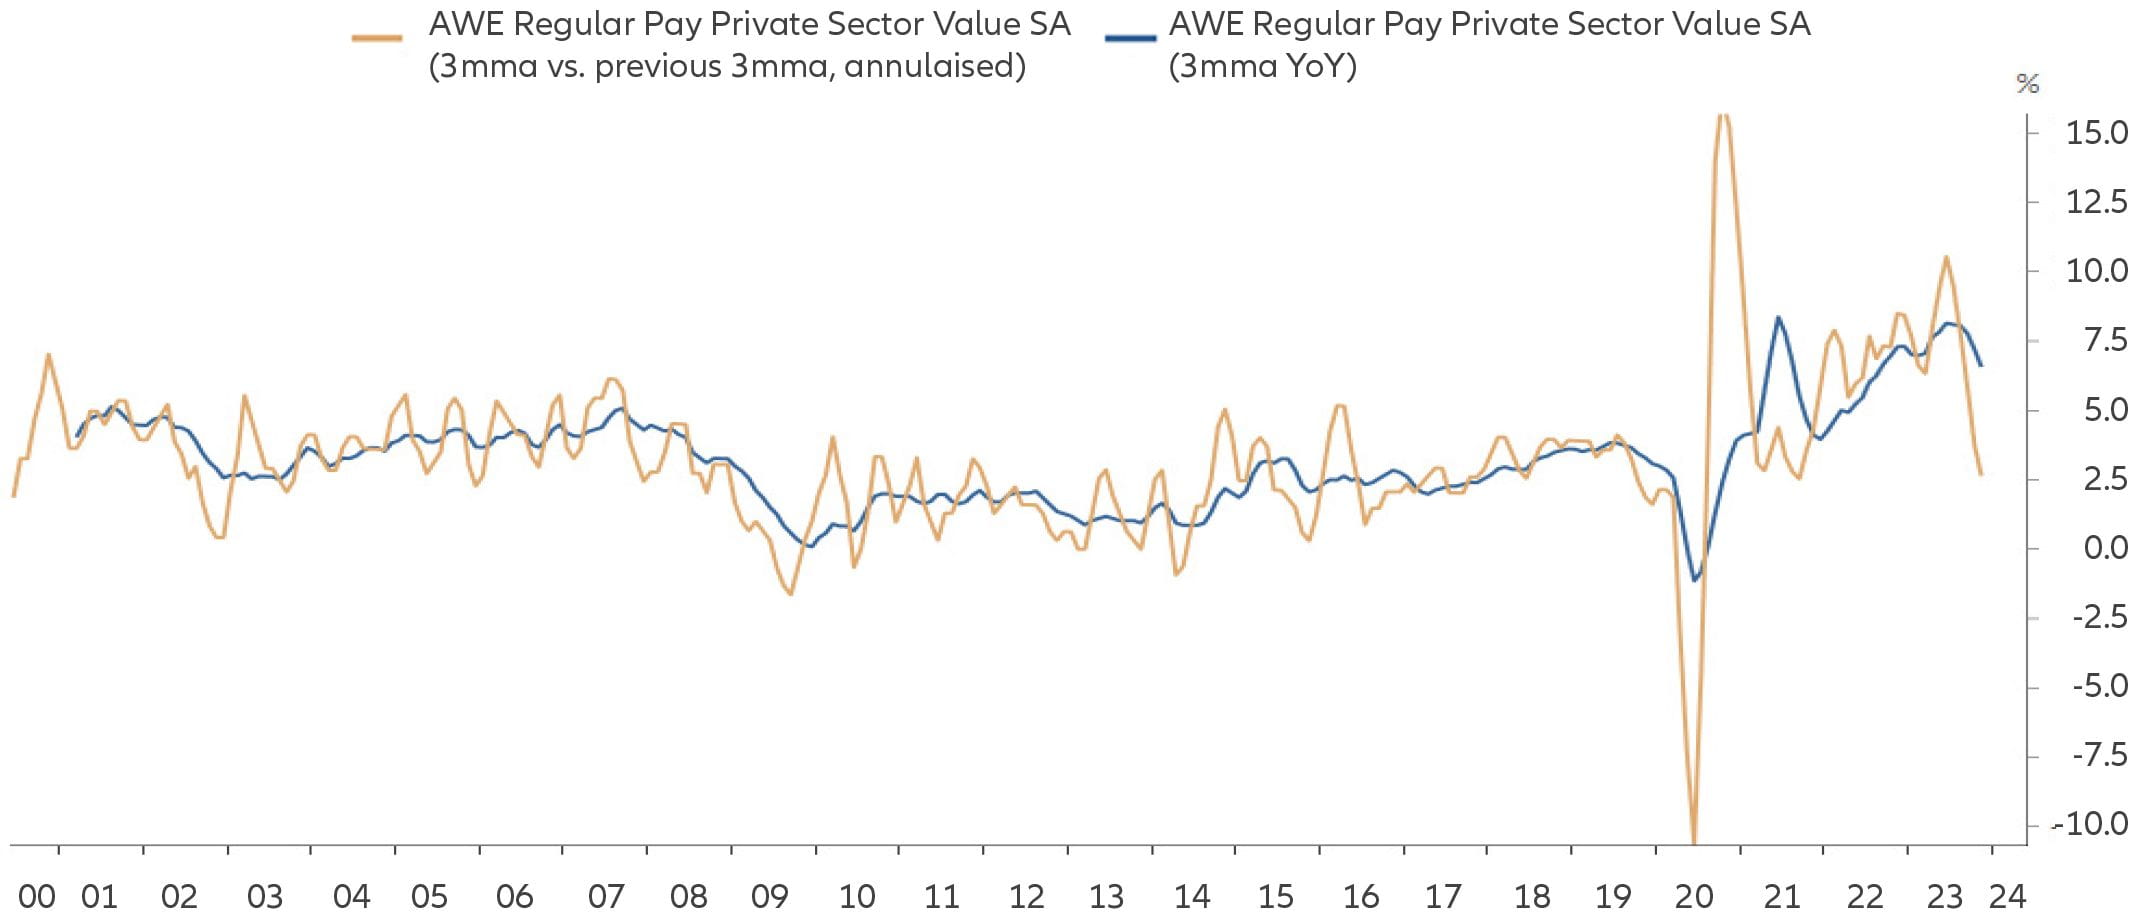
If the BoE follows the path priced in by the rates market, we have little doubt that the BoE will succeed in destroying aggregate demand. Indeed, Swati Dhingra, a member of the BoE’s Monetary Policy Committee, in October 2023 estimated that only 20-25% of the BoE’s interest hikes had so far fed through to the economy. We are seeing clear signs of slack appearing in the labour market, which is evidence that all the BoE hikes are succeeding in breaking the economy, where again the economy has yet to feel barely even half the impact of the rate hikes of the last 2 years. Economic growth is therefore set to weaken as the previous rate hikes bite, which should rein in inflation further, which makes us bullish of gilts.
Chart 3: UK private sector regular pay average weekly earnings

Source: Macrobond, data as at 16/01/2024. Past performance does not predict future returns. AWE = average weekly earnings.
Upcoming gilt supply fears
We had been long concerned that the surge in net gilt supply over the coming couple of years was not yet factored into the long end of the gilt market, where by ‘net’ we mean gross gilt supply adjusted for BoE purchases. Although the UK’s Debt Management Office (DMO) is unlikely to issue anywhere near as many gilts as during the crises of the past 15 years, the difference is that during prior recessions, the BoE mopped up this supply via its Quantitative Easing (QE) programme, leaving very little issuance for the private sector to take down.
This time around, the BoE is selling gilts too, where it is set to reduce its balance sheet by £100bn in the second year of Quantitative Tightening (QT), as bonds mature or are actively sold. The BoE bought these bonds at much lower yields, and while QE initially was a ‘profit’ for the Treasury department, the BoE estimated in July 2023 that the size of the mark to market losses from its QE programme were £150bn. Given the back up in the BoE base rate and gilt yields since this estimate, then it’s likely to now be closer to £200bn. That’s not to say that the Treasury suddenly needs to find £200bn – it only needs to underwrite realised losses on the QT programme plus the interest costs on the BoE’s assets (where these combined losses are so far £25bn). But in addition, QT pushes gilt yields higher, which increases the interest cost to the Treasury from when it needs to issue new gilts too. It is easy to see how things can get horribly circular, where higher gilt yields means bigger deficits, which leads to more gilt issuance, and so on.
It's hard to make a judgement call on when this ugly supply picture is priced in by markets, and we are not yet outright bullish on longer-dated gilts. However, 30-year gilt yields are now at 4.4% (at the time of writing, as of 12/01/24), where you need to go back 25 years prior to BoE independence for longer dated gilt yields to be materially higher than this, and we think a lot of the bad news around gilt supply is now priced in.
The chart below from Goldman Sachs paints a similar picture, where for the past decade, long-dated gilt yields have generally moved with net gilt supply (i.e., gross issuance minus net BoE purchases and reinvestments). The blue dotted line is an estimate of future supply, which is clearly liable to change. But longer-dated yields do appear to already be broadly reflecting the upcoming net supply, and therefore reflect close to fair value.
Chart 4: Goldman Sachs’ estimate of gilt supply and corresponding 30y UK Gilt yield

Source: Goldman Sachs. Goldman Sachs Market Strats. Data as of 22 December 2023. Past performance does not predict future returns. APF = the Bank of England’s Asset Purchase Facility.
To put a 4.4% yield on 30-year gilts into perspective, if bought today and held to maturity, then the nominal total return compounds up to 260% over the life of the bond. Contrast this to as recently as December 2021, when 30-year gilt yields were at 0.8%, which compounded to a total return of just 27% if the 30-year gilt yield was held to maturity.
Whether or not a 4.4% yield on a 30-year gilt ends up a good investment in the long-term will be largely down to where economic growth and inflation head in the long term, but even if UK CPI averages 3% over the next 30 years (and it has averaged +2.4% over the last 25 years), then we believe that a 4.4% nominal yield is not unattractive.
In summary, the supply picture does remain bleak for longer-dated gilts, however it is notable that the gilt curve has already steepened substantially versus other markets, so we believe that a lot of this bad news is now priced in. Consequently, we do not have a strong conviction view on the UK curve.
Chart 5: 30-year UK conventional gilt yields, since Bank of England independence in 1997

Source: Bloomberg, 01/01/1997 – 31/12/2023. Past performance does not predict future returns.


